Executive Summary
Between 2019 and 2025 the U.S. smartphone market experienced modest overall volume growth, a strong tilt toward premium iPhone models, and structural changes in where phones are assembled. Apple consolidated share in the U.S., Samsung remained a strong #2 with periodic rebounds, and other Android vendors (Google, Motorola, OnePlus) kept niche but meaningful positions. The U.S. repair market has been stable-to-growing, driven mainly by screen and battery replacements; estimates put U.S. repair market value in the low billions (several sources indicate figures between about $3.8B–$5.0B in recent years depending on methodology). Consumer sentiment has moved toward repairing for cost and sustainability reasons, while right-to-repair activism and changing OEM policies reshaped the repair landscape. Key sources used for this report include StatCounter (U.S. vendor shares), IDC/Canalys/Counterpoint for shipment and vendor trends, IBISWorld/market reports for repair market sizing, and surveys and advocacy reports on repair attitudes. StatCounter Global Stats+2卫报+2
Methodology & Sources
This report aggregates public industry tracker data (StatCounter, Canalys, IDC, Counterpoint), industry market reports (IBISWorld, MarketSparks), news reporting (Reuters, The Guardian), and industry/advocacy white papers (Consumer Reports / right-to-repair, iFixit / repairer surveys). Where possible I cite year-by-year highlights and attach the primary source for verification. Note: different trackers use different definitions (shipments vs install base vs sales through channels) — this report flags the metric used when relevant. StatCounter Global Stats+2Reuters+2
Market Overview (2019–2025): key shifts and timeline
2019 snapshot
2019 was characterized by a mature U.S. market dominated by Apple and Samsung. 5G was not yet mainstream; device upgrades were steady but not brisk. Global supply dynamics (Huawei’s strength globally) had limited direct effect in the U.S. due to prior carrier/OEM positioning. (Trackers show Apple strong in U.S.; global figures differ.) StatCounter Global Stats+1
2020: pandemic slump & 5G acceleration
COVID-19 reduced device replacement frequency early in 2020, but carriers and OEMs accelerated 5G device rollouts. The iPhone 12 family (released late 2020) drove renewed upgrade cycles into 2021. Supply-chain disruption also began. counterpointresearch.com
2021–2022: recovery, supply-chain turbulence, and chipset shortages
Demand recovered in 2021. Chip shortages and supply chain constraints constraints in 2021–2022 created uneven shipment figures and occasional SKU shortages (affecting some Android OEMs more). Carriers pushed trade-in programs to smooth recounterpointresearch.comurn0search4
2023: iPhone momentum & changing vendor share
2023 was a pivotal year: some industry trackers reported Apple overtaking Samsung globally in shipments (driven by strong iPhone sales including the iPhone 14/15 refresh cycle), and in the U.S. Apple’s share strengthened further as premium replacement cycles remai卫报turn0news40
2024: stabilization and model refresh cycles
By 2024 shipments stabilized, incremental feature upgrades (camera, battery life, AI features in 2024/2025 models) nudged replacement demand. Carrier promotions and trade-ins kept chcounterpointresearch.comurn0search4
2025: manufacturing shifts and tariff-driven sourcing changes
2025 saw an important supply-chain shift: a notable increase in U.S imports of India-assembled phones and reduced China assembly share, partly due to tariff/geo-strategic moves and OEM production diversification. Canalys/Reuters coverage in mid-2025 highlights India’s fast rise as a production base for phones bound for the U.S. market. This can influence costs, spacing of model launches, and repair-parts supply chains over the coReutersturn0news42
Brand market share in the U.S. (by year and trends)
Overall vendor ranks in the U.S. (Apple leading, Samsung second) have been consistent; exact percentages fluctuate by quarter and data source. StatCounter provides rolling vendor share snapshots for the U.S.; industry shipment trackers (IDC/Counterpoint/Canalys) provide quarterly shipment-based shares. Recent snapshots show Apple with a sustained majority share in the U.S. install base/usage metrics, with Samsung second; other brands (Google Pixel, Motorola, OnePlus) occupy smaller residentStatCounter Global Stats+1urn0search0
Apple — Strengths: strong loyalty, carrier partnerships, trade-in schemes, and premium pricing. Apple’s U.S. share rose through the early-2020s as iPhone refresh models sold well.
Samsung — Strengths: broad portfolio across premium and midrange, deep carrier channel presence. Samsung shows periodic rebounds tied to flagship launches.
Other vendors — Google (Pixel) grew modestly with strong camera and software marketing, Motorola/Lenovo have stable presence in carrier/prepaid channels, and Xiaomi/OnePlus have constrained U.S. share because of distribution limits and regulatory complexity.
(For specific yearly percentages consult the StatCounter U.S. vendor chart and Counterpoint/IDC quarterly releases for year-by-year shipmenStatCounter Global Stats+1urn0search0
Top-selling models in the U.S. (2019–2025): year-by-year highlights
Rather than an exhaustive SKU list by year, here are the recurring patterns:
- 2019–2020: iPhone XR/11 and later iPhone 12 line were major sellers in the U.S.; Samsung Galaxy S10/S20 and Galaxy A-series filled other top slots. (See tracker 维基百科+1urn0search4
- 2021–2022: iPhone 12/13 families dominated upgrade waves; in Android, Samsung Galaxy S21/S22 and Google Pixel 6/7 wecounterpointresearch.comurn0search4
- 2023–2024: iPhone 14/15 series and Galaxy S23/S24 class devices sold well; Apple’s premium models often topped U.S. carrier best-seller lists. Global-level tracker commentary documented Apple reaching top global shipmen卫报turn0news40
- 2025: iPhone 15/16 upgrades and refreshed Samsung lines continued to be strong sellers in the U.S., while India-assembled models grew in channel presence (per 2025 Q2 Reutersturn0news42
Channel note: Prepaid/carrier channels (e.g., Verizon, AT&T, T-Mobile) significantly influence top-seller lists in the U.S. because carrier subsidies and installment plans drive many purchases.
The U.S. phone repair market: size, segments, and growth (2019–2025)
Market size & CAGR
Estimates vary with methodology. IBISWorld shows the U.S. Cell Phone Repair industry revenue in recent years in the low-to-mid billions (market descriptions cite figures like ~$3.8B for 2023 in some reports and a figure of around $4.0B in 2023 depending on the report). Other market-research aggregators estimate the broader “smartphone repair” TAM at higher numbers (MarkSparks estimated ~USD 5.0B for 2024). Projections often assume mid-single-digit CAGR toward 2030. Differences reflect whether estimates include DIY parts, refurbished device resale, mail-in services, and enterpriseIBISWorld+1urn0search8
Repair types (by frequency & revenue share)
- Screen/display replacement — Single largest category in unit volume and often highest revenue share for independent shops.
- Battery replacement — Frequent, lower-cost procedure.
- Camera / port / button repairs — Moderate frequency.
- Water damage / board-level repairs — Lower frequency but high complexity and cost.
- Software & data recovery — Smaller share but growing as device compleIBISWorld+1rn0search16
Distribution of repair channels
- Independent repair shops (local bricks-and-mortar) — historically a major share for consumers wanting fast turnaround and cheaper pricing.
- Carrier/retailer in-store service (e.g., uBreakiFix by Asurion partnerships, carrier stores) — growing due to convenience and trust.
- OEM-authorized service centers and mail-in OEM repair — preferred for warranty or complex repairs; often more expensive.
- Mail-in services & aggregator platforms — growing due to convenience / pandemic accelerated IBISWorldurn0search1
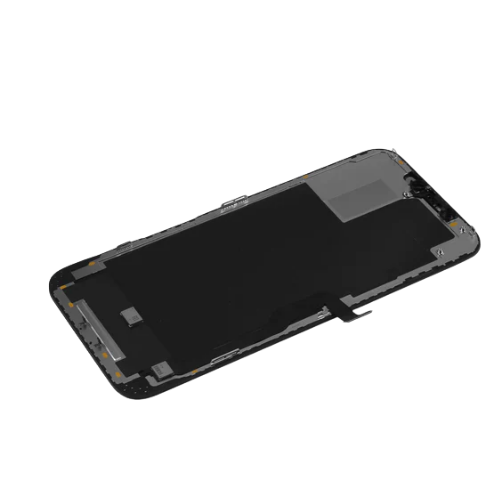
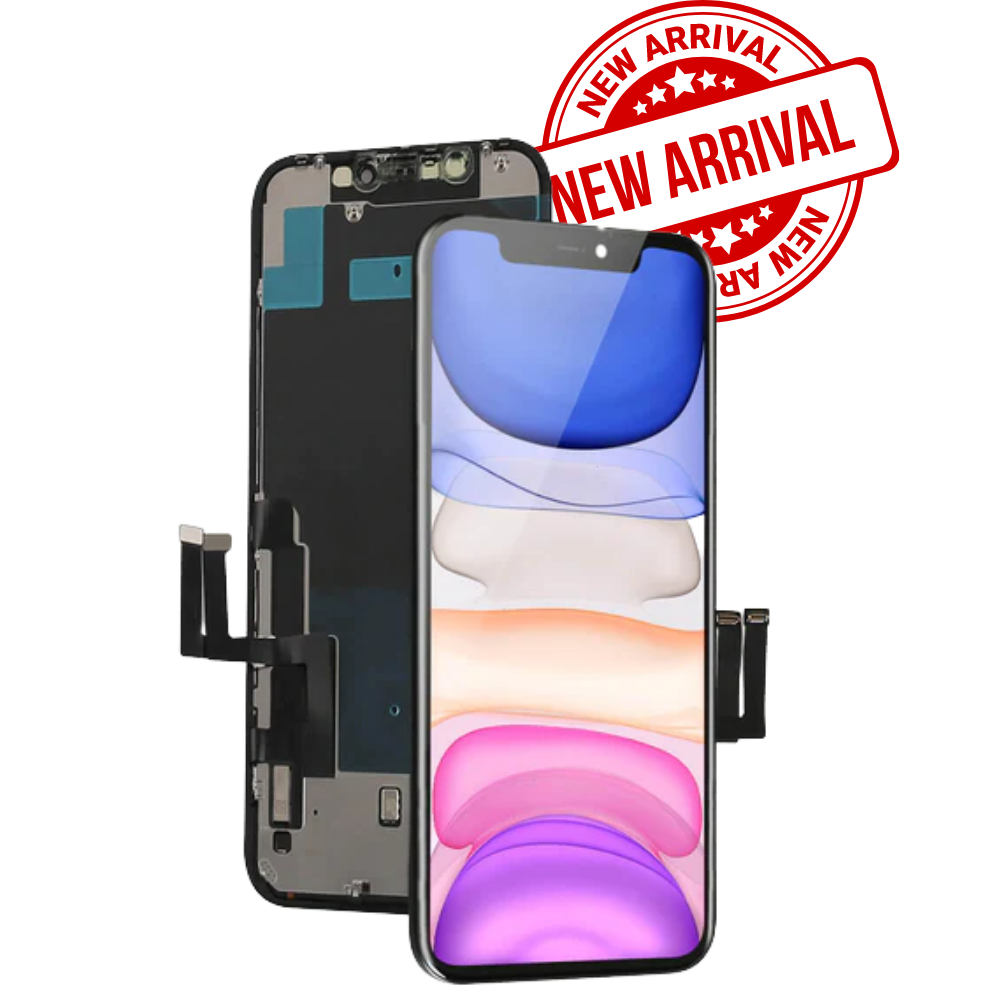
LCD/OLED/display specifications common in U.S. repair market
Between 2019 and 2025, display tech in popular U.S. models shifted from LCD (2019 midrange/older models) to OLED for most premium midrange and flagship phones. Common specs repair shops see now:
- Panel types: TFT-LCD (legacy), OLED / AMOLED (dominant on premium devices), LTPO OLED (for variable refresh in higher-end phones).
- Sizes: 5.4″–6.8″ diagonal typical, with 6.1″ and 6.7″ common for Apple/Samsung flagships.
- Resolution & features: Full HD+ to QHD+ for Android flagships; ProMotion / high refresh rates (90–120Hz) on many 2021+ flagships and Pro-level iPhones (from iPhone 13/14 Pro onward).
- Connector / module differences: Modern repairs often require model-specific modules (frame adhesives, flex cable revisions), increasing SKU complexity for recounterpointresearch.comurn0search4
U.S. consumer attitudes toward phone repair (cost, right-to-repair, environment)
Repair vs replace economics
Surveys indicate repair cost is a key barrier: many consumers will forgo repair if the quote approaches replacement cost. A 2023–2024 consumer survey series found average repair/replacement costs around the low hundreds (average repair/replacement expense figures reported ~USD 302 in some surveys), and roughly half of respondents said they would not repair a damaged but functional smartphone because of Claims Journalurn0search2
Right-to-repair & sustainability
Right-to-repair activism increased legislative activity in the U.S. (several states passed or considered right-to-repair laws in early-to-mid 2020s). Repair advocates and businesses emphasize sustainability benefits (reduced e-waste) and cost-savings for consumers. OEMs have responded variably — some offering increased repair options or parts sales, others restricting certain parts or tools for safety/security. White papers and advocacy reports document both progress and friction inadvocacy.consumerreports.org+1urn0search9
Regulatory & industry actions affecting repair
- State and federal right-to-repair pushes — emerging laws and bills affect parts availability and repair workflows. Consumer Reports and Repair.org have been active in advocacy and comment sadvocacy.consumerreports.orgurn0search6
- OEM repair programs — Apple and other OEMs have announced expansions to authorized-repair or independent repair programs (with caveats). Independent shops still report concerns about parts availability and software locks for certaThe Public Interest Networkurn0search9
Opportunities & threats for repair businesses and retailers
Opportunities
- Rising device complexity creates higher-margin board-level and diagnostic work.
- Sustainability and consumer activism enable marketing differentiation.
- Partnerships with carriers and buyback/trade-in programs provide steady repMark & Spark Solutionsurn0search8
Threats
- OEM restrictions (parts/tools/firmware locks).
- Falling device prices at some tiers reducing repair economics.
- Supply-chain shifts (e.g., more India-assembled phones) may change parts sourcing dynamics and Reutersturn0news42
Recommendations
For OEMs
- Increase transparent parts distribution and certification paths to authorized and independent repairers to build goodwill and reduce e-waste. Consider modular design choices to simplify common repairs.
For Carriers & Retailers
- Bundle repair/insurance/trade-in offers. Expand in-store quick-repair capability for screens and batteries to capture convenience-driven demand.
For Independent Repair Shops
- Invest in training for board-level and software unlock diagnostics. Diversify services (screen protector/insurance partnerships, enterprise device support) and build online mail-in channels.
For Investors
- Evaluate repair-vertical consolidators, diagnostic-tool makers, and parts distribution platforms; right-to-repair momentum could enable scalable IBISWorld+1urn0search9
Conclusion
From 2019 through 2025 the U.S. smartphone market showed resilience and consolidation: Apple strengthened its U.S. foothold while Samsung remained the principal Android competitor. The repair market stayed relevant and commercially meaningful — primarily driven by screen and battery replacements but moving toward more complex board-level work. The twin forces of consumer cost sensitivity and sustainability-minded regulation (right-to-repair) create a favorable environment for repair expansion, though OEM policies and shifting supply chains introduce risks. For stakeholders — OEMs, carriers, independent repair shops, and investors — success will depend on adapting supply chains, expanding transparent parts access, and aligning commercial offers to consumer demand for affordable, quick repairs.
FAQs
Q1: What were the biggest seller phone models in the U.S. across 2019–2025?
A1: iPhone models (XR / 11 / 12 / 13 / 14 / 15 families) consistently topped U.S. sales in that period, with Samsung flagship and midrange Galaxy models and Google Pixel line-ups being the main Android competitors. (See IDC/Counterpoint / StatCounter for yearly b卫报+1rn0search14
Q2: How large is the U.S. phone repair market?
A2: Estimates vary: IBISWorld reports the U.S. Cell Phone Repair industry in the low-to-mid billions (e.g., ~$3.8–4.0B range in recent years depending on the report), while some market-forecast providers estimate the broader smartphone repair market somewhat higher (~$5B in 2024). Differences come from inclusion/exclusion of mail-in services, refurbished-device flows, and paIBISWorld+1urn0search8
Q3: Which repair type accounts for most shop visits?
A3: Screen/display replacements are the single most common repair type by unit volume, followed by battery replacements and then camera/port repairs. Board-level repairs are less frequent but more profitabIBISWorldurn0search1
Q4: Are consumers in the U.S. open to repairing phones?
A4: Many consumers favor repair for cost and sustainability reasons, but a significant portion will opt not to repair if repair quotes approach replacement cost. Surveys suggest cost is the single largest barrier. Right-to-repair momentum shows rising consumer/advocacy interest in easier, cheapClaims Journal+1urn0search6
Q5: How will 2025 manufacturing shifts affect repair shops?
A5: Increased phone assembly in India and other non-China locations (seen in 2025 reporting) can change parts logistics, lead times, and SKUs in shops’ supply chains — potentially improving resilience but also requiring shops to track variant-specific parts and firmware dReutersturn0news42