Resumen ejecutivo
Entre 2019 y 2025 Estados Unidos. El mercado de teléfonos inteligentes experimentó un modesto crecimiento en volumen general., una fuerte inclinación hacia los modelos premium de iPhone, y cambios estructurales en el lugar donde se ensamblan los teléfonos. Apple consolida participación en EE.UU., Samsung siguió siendo fuerte #2 con rebotes periódicos, y otros proveedores de Android (Google, Motorola, OnePlus) Mantuve posiciones especializadas pero significativas.. Estados Unidos. El mercado de reparación se ha mantenido estable y en crecimiento., Impulsado principalmente por reemplazos de pantalla y batería.; las estimaciones sitúan a EE.UU.. valor de mercado de reparación en unos pocos miles de millones (Varias fuentes indican cifras entre aproximadamente 3.800 millones de dólares y 5.000 millones de dólares en los últimos años, según la metodología.). El sentimiento del consumidor se ha inclinado hacia la reparación por razones de costo y sostenibilidad., mientras que el activismo por el derecho a reparar y las políticas cambiantes de los OEM remodelaron el panorama de las reparaciones.. Las fuentes clave utilizadas para este informe incluyen StatCounter (A NOSOTROS. acciones de proveedores), IDC/Canalys/Counterpoint para envíos y tendencias de proveedores, IBISWorld/Informes de mercado para dimensionar el mercado de reparación, y encuestas e informes de promoción sobre actitudes reparadoras.. StatCounter Estadísticas globales+2 Guardián+2
Metodología & Fuentes
Este informe agrega datos de seguimiento de la industria pública. (contador de estadísticas, canallys, IDC, Contrapunto), informes de mercado de la industria (IBISMundo, chispas de mercado), reportaje de noticias (Reuters, el guardián), y libros blancos sobre la industria y la promoción (Informes del consumidor / derecho a reparar, iFixit / encuestas de reparadores). Siempre que sea posible, cito los aspectos más destacados año por año y adjunto la fuente principal para su verificación.. Nota: diferentes rastreadores usan diferentes definiciones (envíos vs base instalada vs ventas a través de canales) — este informe señala la métrica utilizada cuando sea relevante. Estadísticas globales de StatCounter+2Reuters+2
Descripción general del mercado (2019–2025): cambios clave y cronograma
2019 instantánea
2019 se caracterizó por un Estados Unidos maduro. Mercado dominado por Apple y Samsung.. 5G aún no era popular; las actualizaciones de dispositivos fueron constantes pero no rápidas. Dinámica de la oferta global (La fuerza de Huawei a nivel mundial) tuvo un efecto directo limitado en los EE. UU.. debido al posicionamiento previo del operador/OEM. (Los rastreadores muestran que Apple es fuerte en EE. UU.; Las cifras globales difieren.) Estadísticas globales de StatCounter+1
2020: caída pandémica & 5aceleración
COVID-19 redujo la frecuencia de reemplazo de dispositivos al principio 2020, pero los operadores y los fabricantes de equipos originales aceleraron el lanzamiento de dispositivos 5G. El iPhone 12 familia (liberado tarde 2020) impulsó ciclos de actualización renovados 2021. También comenzó la interrupción de la cadena de suministro.. contrapuntoresearch.com
2021–2022: recuperación, turbulencia en la cadena de suministro, y escasez de chipsets
La demanda se recuperó en 2021. La escasez de chips y las limitaciones de la cadena de suministro en 2021-2022 crearon cifras de envío desiguales y escasez ocasional de SKU (afectando más a algunos OEM de Android). Los transportistas impulsaron programas de intercambio para suavizar la recontrapuntoresearch.comurn0search4
2023: impulso del iPhone & cambiando la cuota de proveedores
2023 fue un año crucial: Algunos rastreadores de la industria informaron que Apple superó a Samsung a nivel mundial en envíos. (impulsado por fuertes ventas de iPhone, incluido el iPhone 14/15 ciclo de actualización), y en estados unidos. La participación de Apple se fortaleció aún más a medida que persisten los ciclos de reemplazo de primas.el guardiánturn0news40
2024: ciclos de estabilización y actualización del modelo.
Por 2024 envíos estabilizados, actualizaciones incrementales de funciones (cámara, duración de la batería, Funciones de IA en 2024/2025 modelos) demanda de reemplazo impulsada. Las promociones y los intercambios de operadores se mantuvieron chcontrapuntoresearch.comurn0search4
2025: Cambios en la fabricación y cambios en el abastecimiento impulsados por los aranceles.
2025 vio un cambio importante en la cadena de suministro: un aumento notable en las importaciones estadounidenses de teléfonos ensamblados en la India y una reducción de la participación del ensamblaje en China, en parte debido a movimientos arancelarios/geoestratégicos y a la diversificación de la producción OEM. La cobertura de Canalys/Reuters a mediados de 2025 destaca el rápido ascenso de la India como base de producción de teléfonos con destino a EE. UU.. mercado. Esto puede influir en los costos., espaciado de lanzamientos de modelos, y cadenas de suministro de repuestos en todo el mundo.Reutersturn0news42
Cuota de mercado de la marca en EE. UU.. (por año y tendencias)
Clasificación general de proveedores en EE. UU.. (Apple liderando, Samsung segundo) han sido consistentes; Los porcentajes exactos fluctúan según el trimestre y la fuente de datos.. StatCounter proporciona instantáneas de la participación de proveedores en los EE. UU.; rastreadores de envíos industriales (IDC/Contrapunto/Canalys) proporcionar acciones trimestrales basadas en envíos. Instantáneas recientes muestran a Apple con una participación mayoritaria sostenida en EE.UU.. instalar base/métricas de uso, con Samsung segundo; otras marcas (Google Píxel, Motorola, OnePlus) ocupar residente más pequeñoEstadísticas globales de StatCounter+1urn0search0
Manzana — Fortalezas: fuerte lealtad, asociaciones de transportistas, esquemas de intercambio, y precios premium. Estados Unidos de Apple. la participación aumentó hasta principios de la década de 2020 a medida que los modelos actualizados de iPhone se vendieron bien.
Samsung — Fortalezas: Amplia cartera en gama premium y media., presencia profunda del canal portador. Samsung muestra rebotes periódicos vinculados a lanzamientos emblemáticos.
Otros proveedores - Google (Píxel) creció modestamente con un fuerte marketing de cámaras y software, Motorola/Lenovo tienen presencia estable en canales de operador/prepago, y Xiaomi/OnePlus han limitado a EE.UU.. compartir debido a los límites de distribución y la complejidad regulatoria.
(Para porcentajes anuales específicos consulte StatCounter U.S.. gráfico de proveedores y publicaciones trimestrales de Counterpoint/IDC para transportistas año tras añoEstadísticas globales de StatCounter+1urn0search0
Modelos más vendidos en EE. UU.. (2019–2025): aspectos destacados año tras año
En lugar de una lista exhaustiva de SKU por año, aquí están los patrones recurrentes:
- 2019–2020: iPhone XR/11 y iPhone posterior 12 línea fueron los principales vendedores en los EE. UU.; Samsung Galaxy S10/S20 y Galaxy A-series ocuparon otros puestos superiores. (Ver rastreador Wikipedia +1urn0search4
- 2021–2022: iPhone 12/13 las familias dominaron las oleadas de mejoras; en Android, Samsung Galaxy S21/S22 y Google Píxel 6/7 nosotroscontrapuntoresearch.comurn0search4
- 2023–2024: iPhone 14/15 Los dispositivos de la serie y de la clase Galaxy S23/S24 se vendieron bien; Los modelos premium de Apple a menudo superan a los de EE. UU.. listas de los más vendidos del operador. El comentario del rastreador a nivel global documentó que Apple llegó a los principales transportistas globalesel guardiánturn0news40
- 2025: iPhone 15/16 Las actualizaciones y las líneas renovadas de Samsung continuaron siendo fuertes vendedores en los EE. UU., mientras que los modelos ensamblados en India crecieron en presencia en el canal (por 2025 Q2 Reutersturn0news42
nota del canal: Canales prepago/operador (P.EJ., Verizon, EN&t, T-Mobile) influyen significativamente en las listas de los más vendidos en los EE. UU.. porque los subsidios de los operadores y los planes de pago a plazos impulsan muchas compras.
Estados Unidos. mercado de reparación de teléfonos: tamaño, segmentos, y crecimiento (2019–2025)
Tamaño del mercado & CAGR
Las estimaciones varían según la metodología.. IBISWorld muestra los EE.UU.. Cell Phone Repair industry revenue in recent years in the low-to-mid billions (market descriptions cite figures like ~$3.8B for 2023 in some reports and a figure of around $4.0B in 2023 depending on the report). Other market-research aggregators estimate the broader “smartphone repair” TAM at higher numbers (MarkSparks estimated ~USD 5.0B for 2024). Projections often assume mid-single-digit CAGR toward 2030. Differences reflect whether estimates include DIY parts, refurbished device resale, mail-in services, and enterpriseIBISWorld+1urn0search8
Repair types (by frequency & revenue share)
- Screen/display replacement — Single largest category in unit volume and often highest revenue share for independent shops.
- Reemplazo de batería — Frequent, lower-cost procedure.
- Cámara / port / button repairs — Moderate frequency.
- Daños por agua / board-level repairs — Menor frecuencia pero alta complejidad y costo.
- Software & recuperación de datos — Participación más pequeña pero creciendo a medida que se completa el dispositivoIBISWorld+1rn0search16
Distribución de canales de reparación.
- Talleres de reparación independientes (ladrillos y mortero locales) — históricamente una parte importante de los consumidores que desean una respuesta rápida y precios más baratos.
- Servicio de transportista/minorista en tienda (P.EJ., uBreakiFix por las asociaciones de Asurion, tiendas de transporte) — creciendo debido a la conveniencia y la confianza.
- Centros de servicio autorizados por OEM y reparación OEM por correo — preferido para garantía o reparaciones complejas; a menudo más caro.
- Servicios de correo & plataformas agregadoras — creciendo debido a la conveniencia / pandemia acelerada IBISMundourn0search1
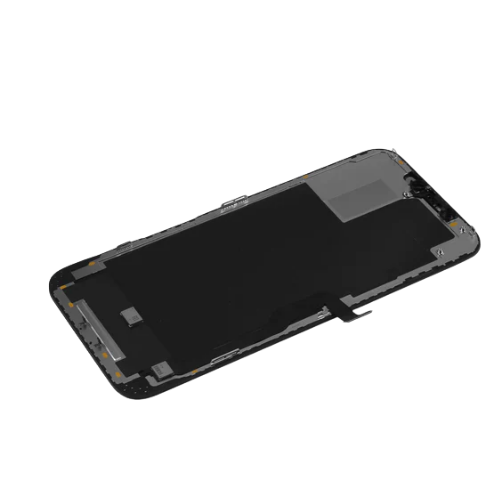
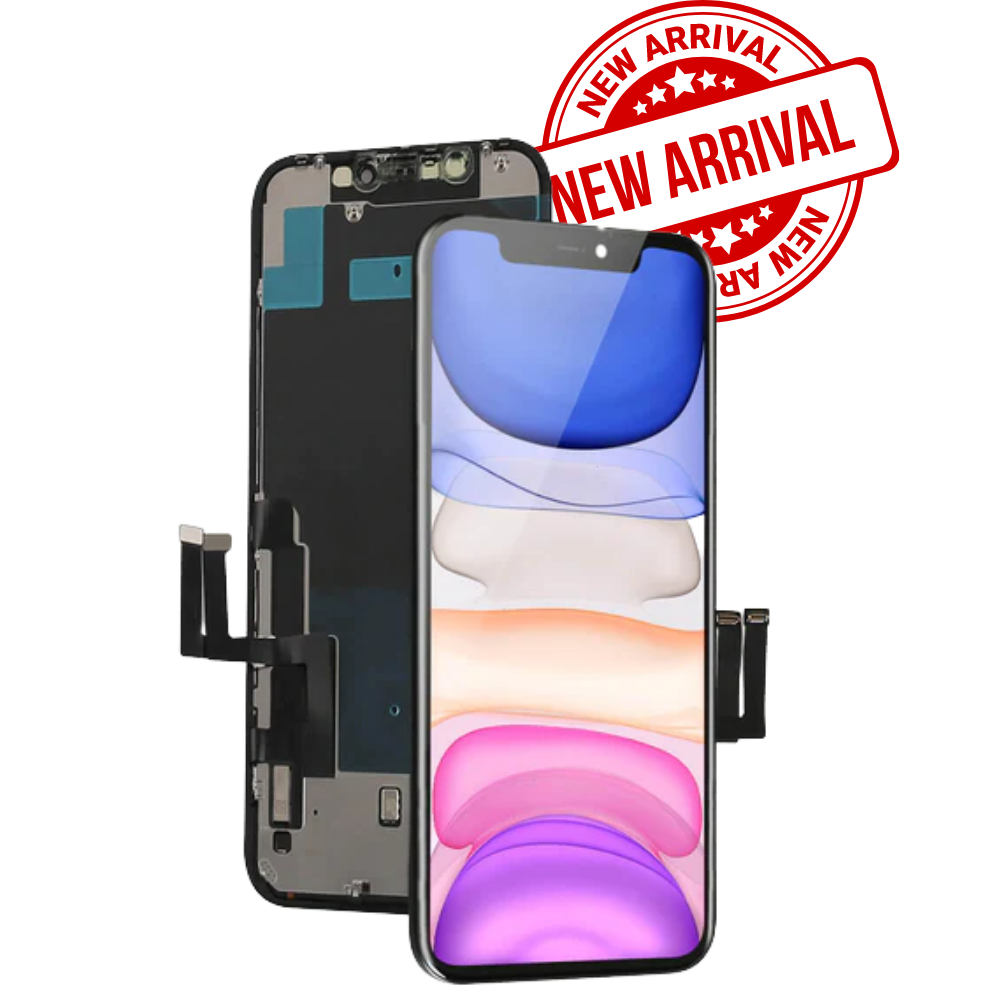
Especificaciones de LCD/OLED/pantalla comunes en EE. UU.. mercado de reparación
Entre 2019 y 2025, tecnología de visualización en EE. UU. popular. modelos cambiados de LCD (2019 modelos de gama media/antiguos) a OLED para la mayoría de los teléfonos insignia y de gama media premium. Common specs repair shops see now:
- Tipos de paneles: LCD TFT (legado), Oleado / Amolado (dominant on premium devices), LTPO ERES (for variable refresh in higher-end phones).
- Sizes: 5.4″–6.8″ diagonal typical, with 6.1″ and 6.7″ common for Apple/Samsung flagships.
- Resolución & características: Full HD+ to QHD+ for Android flagships; Promoción / altas tasas de actualización (90–120Hz) on many 2021+ flagships and Pro-level iPhones (from iPhone 13/14 Pro onward).
- Connector / module differences: Modern repairs often require model-specific modules (frame adhesives, flex cable revisions), increasing SKU complexity for recontrapuntoresearch.comurn0search4
A NOSOTROS. consumer attitudes toward phone repair (costo, derecho a reparar, environment)
Repair vs replace economics
Surveys indicate repair cost is a key barrier: many consumers will forgo repair if the quote approaches replacement cost. A 2023–2024 consumer survey series found average repair/replacement costs around the low hundreds (average repair/replacement expense figures reported ~USD 302 in some surveys), y aproximadamente la mitad de los encuestados dijeron que no repararían un teléfono inteligente dañado pero funcional debido a Diario de reclamacionesurn0search2
Derecho a reparar & sostenibilidad
El activismo por el derecho a reparar aumentó la actividad legislativa en EE. UU.. (varios estados aprobaron o consideraron leyes sobre el derecho a reparar a principios y mediados de la década de 2020). Los defensores de la reparación y las empresas destacan los beneficios de la sostenibilidad (reducción de residuos electrónicos) y ahorro de costes para los consumidores. Los fabricantes de equipos originales han respondido de forma variable: algunos ofrecen mayores opciones de reparación o ventas de piezas., otros que restringen ciertas piezas o herramientas por motivos de seguridad. Los libros blancos y los informes de promoción documentan tanto el progreso como las fricciones endefensa.consumerreports.org+1urn0search9
Regulador & acciones de la industria que afectan la reparación
- Impulsos estatales y federales por el derecho a reparar — Las leyes y proyectos de ley emergentes afectan la disponibilidad de piezas y los flujos de trabajo de reparación.. Consumer Reports y Repair.org han estado activos en la promoción y comentarios.defensa.consumerreports.orgurn0search6
- Programas de reparación OEM — Apple y otros fabricantes de equipos originales han anunciado ampliaciones a los programas de reparación autorizada o de reparación independiente. (con advertencias). Los talleres independientes todavía informan preocupaciones sobre la disponibilidad de piezas y los bloqueos de software para ciertosLa Red de Interés Públicourn0search9
Oportunidades & amenazas para las empresas de reparación y los minoristas
Oportunidades
- La creciente complejidad de los dispositivos crea un mayor margen de trabajo a nivel de placa y de diagnóstico.
- La sostenibilidad y el activismo del consumidor permiten la diferenciación del marketing.
- Las asociaciones con transportistas y los programas de recompra/intercambio brindan una reputación constanteMarca & Soluciones de chispaurn0search8
Amenazas
- Restricciones OEM (piezas/herramientas/cerraduras de firmware).
- La caída de los precios de los dispositivos en algunos niveles reduce la economía de reparación.
- Cambios en la cadena de suministro (P.EJ., Más teléfonos ensamblados en India) puede cambiar la dinámica de abastecimiento de piezas y Reutersturn0news42
Recomendaciones
Para fabricantes de equipos originales
- Incrementar las rutas transparentes de distribución y certificación de piezas a reparadores autorizados e independientes para generar buena voluntad y reducir los desechos electrónicos.. Considere opciones de diseño modular para simplificar las reparaciones comunes.
Para transportistas & Minoristas
- Ofertas combinadas de reparación/seguro/intercambio. Ampliar la capacidad de reparación rápida de pantallas y baterías en las tiendas para captar la demanda impulsada por la comodidad..
Para talleres de reparación independientes
- Invierta en capacitación para diagnósticos de desbloqueo de software y a nivel de placa. Diversificar servicios (protector de pantalla/asociaciones de seguros, soporte para dispositivos empresariales) y crear canales de correo en línea.
Para inversores
- Evaluar consolidación de reparación-vertical, fabricantes de herramientas de diagnóstico, y plataformas de distribución de repuestos; El impulso del derecho a reparar podría permitir mejoras escalables. IBISWorld+1urn0search9
Conclusión
De 2019 a través de 2025 Estados Unidos. El mercado de teléfonos inteligentes mostró resiliencia y consolidación.: Apple fortaleció su EE.UU.. punto de apoyo mientras Samsung seguía siendo el principal competidor de Android. El mercado de reparación siguió siendo relevante y comercialmente significativo, impulsado principalmente por el reemplazo de pantallas y baterías, pero avanzando hacia trabajos más complejos a nivel de placa.. Las fuerzas gemelas de la sensibilidad a los costos del consumidor y la regulación orientada a la sostenibilidad (derecho a reparar) crear un entorno favorable para la expansión de la reparación, aunque las políticas OEM y los cambios en las cadenas de suministro introducen riesgos. Para las partes interesadas: OEM, transportistas, talleres de reparación independientes, e inversores: el éxito dependerá de la adaptación de las cadenas de suministro, ampliar el acceso a piezas transparentes, y alinear las ofertas comerciales con la demanda de los consumidores de productos asequibles., reparaciones rápidas.
Preguntas frecuentes
Q1: What were the biggest seller phone models in the U.S. across 2019–2025?
A1: iPhone models (XR / 11 / 12 / 13 / 14 / 15 familias) consistently topped U.S. sales in that period, with Samsung flagship and midrange Galaxy models and Google Pixel line-ups being the main Android competitors. (See IDC/Counterpoint / StatCounter for yearly b卫报+1rn0search14
Q2: How large is the U.S. mercado de reparación de teléfonos?
A2: Estimates vary: IBISWorld reports the U.S. Cell Phone Repair industry in the low-to-mid billions (P.EJ., ~$3.8–4.0B range in recent years depending on the report), while some market-forecast providers estimate the broader smartphone repair market somewhat higher (~$5B in 2024). Differences come from inclusion/exclusion of mail-in services, refurbished-device flows, and paIBISWorld+1urn0search8
Q3: Which repair type accounts for most shop visits?
A3: Los reemplazos de pantallas son el tipo de reparación más común por volumen de unidad, seguido de reemplazos de batería y luego reparaciones de cámara/puerto. Las reparaciones a nivel de placa son menos frecuentes pero más rentables.IBISMundourn0search1
Q4: ¿Son los consumidores de EE.UU.. abierto a reparar teléfonos?
A4: Muchos consumidores prefieren la reparación por razones de coste y sostenibilidad., pero una parte importante optará por no reparar si las cotizaciones de reparación se acercan al costo de reemplazo.. Las encuestas sugieren que el costo es la barrera más grande. El impulso del derecho a reparar muestra un creciente interés de los consumidores y sus defensores en facilitar, baratoDiario de reclamaciones+1urn0search6
Q5: ¿Cómo será? 2025 Los cambios de fabricación afectan a los talleres de reparación?
A5: Mayor ensamblaje de teléfonos en India y otros lugares fuera de China (visto en 2025 informar) puede cambiar la logística de piezas, plazos de entrega, y SKU en las cadenas de suministro de las tiendas, lo que potencialmente mejora la resiliencia, pero también requiere que las tiendas realicen un seguimiento de las piezas y el firmware de variantes específicas.Reutersturn0news42